When choosing a load balancer to front your application’s traffic, there are several factors to consider. Achieving the right balance of features, operator usability, and performance depends on the type of software you’re running, how it’s architected, and what platform it’s running on. While often less of a concern than these other factors, it’s still important to understand the performance profiles of these load balancers under different types of load. In this article, we will test five different popular load balancers: NGINX, HAProxy, Envoy, Traefik, and Amazon Application Load Balancer (ALB). We’ll analyze their performance, and give you the tools to understand them.
Test Methodology
Let’s come up with a methodology for this test so that we have as many fair benchmarks as possible and a range of different information. There are caveats to all benchmarking and it’s important to understand them in relation to your own application testing.
Benchmarking, especially micro-benchmarks, are not a full performance indicator of every configuration and workload. It’s important when testing load balancers for your infrastructure that you perform a more real-world test for your services. For example, your applications may take advantage of HTTP/2, require sticky sessions, have different TLS certificate settings, or require features that another load balancer does not have. The intent of these particular benchmarks is to show out-of-the-box configuration profiles without optimization, and outside of having a backend to another service, use the load balancer’s default configuration.
To understand the performance profiles of these applications, we need to put them under load. We will use a simple load generator, Hey, to generate some sample traffic for these applications to access a simple backend service.
To give us an idea of performance, we will test for three metrics on each load balancer: request rate, request duration, and error rate. Together, these are known as the RED metrics and are a good way of getting a baseline for health on any service. Additionally, we will be performing this test across two categories.
First, understanding a load balancer’s ability to handle concurrent load gives us an understanding of how the load balancer handles spikes in requests across multiple different sources, so we will test performance at three concurrency levels. There is no science here, and we have chosen Hey’s default concurrency of 50, as well as 250 and 500 concurrent requests.
Second, we will test the performance of different protocols: HTTP and HTTPS. Testing HTTPS gives us an idea of the TLS termination performance for these different services. To gather sufficient data for each point, we will issue 1,000,000 requests for each test. This is an arbitrary number with the intent of helping ensure that there are enough requests to run to get meaningful data at higher concurrency levels.
Additionally, in case we want to perform more inspections after the fact, we will be sending traffic logs for these tests to SolarWinds® Loggly®—our log management tool. This in and of itself will affect the performance of our system, but gives us valuable forensic data and would normally be turned on in a production environment.
This is not an exhaustive list of things we can test. Some, but not all, of these load balancers will perform L4, or TCP, load balancing, which is a simple pass-through of traffic and can be much faster. L4 load balancing prevents us from doing TLS termination, so we are skipping it for this test. Additionally, this doesn’t test configurations that require many long-lived open connections such as websockets. Finally, as a basis of comparison, we will include one cloud-based load balancer: Amazon ALB.
Cloud load balancers typically scale to provide consistent performance under load. With our other load balancers restricted to their out-of-the-box configuration, this might not seem fair, but we are evaluating these load balancers on features as well as performance, so ALB is included as a comparison point.
Finally, we need consistent hardware to run our software on, to provide a similar environment across all of our tests. With the exception of our cloud load balancer, we will run these benchmarks on a single t2.medium Amazon Web Services instance, which provides two virtual CPUs. For our backend, we’re using NGINX serving the default static site that ships with it.
Now that we have a well-defined methodology, let’s go over the load balancers we will be testing.
Our Load Balancers
We are testing five different load balancers, chosen in part for their current and historical popularity, feature set, and use in real-world environments. There are many other load balancers, so remember to evaluate the features you need and analyze performance based on your environment.
NGINX Load Balancing
NGINX claims to be a high-performance reverse proxy and load balancer. As of August 2018, it serves 25.03% of traffic of the top 1 million websites. You configure NGINX using a configuration file that can be hot-reloaded, but the NGINX Plus commercial offering enables the use of API-based configuration as well as other features designed for large, enterprise environments.
NGINX uses an evented I/O model for serving traffic. This model is very fast for handling I/O bound workloads such as network traffic, but typically limits parallelism across multiple CPUs. To solve this, NGINX allows for running multiple worker processes, which are forked from the NGINX control process.
Our configuration for NGINX looks like this:
worker_processes 3;

events {
  worker_connections  4096;  ## Default: 1024
}

http {
  log_format timed_combined '$remote_addr - $remote_user [$time_local] ' '"$request" $status $body_bytes_sent ' '"$http_referer" "$http_user_agent" ' '$request_time $upstream_response_time’;
  access_log /dev/stdout timed_combined;
  server {
    listen 80;
    location / {
      proxy_pass https://172.17.0.1:1234;
    }
  }
}
Here we are using a log format that also shows the request time and our upstream server’s response time.
NGINX is highly extensible and is the basis for servers such as OpenResty, which builds upon NGINX with Lua to create a powerful web server and framework.
HAProxy – open-source load balancer
HAProxy is an open-source, microcode-optimized load balancer and claims to feature a , event-driven model. It is used by some of the highest traffic applications on the Internet to power their edge and internal load balancing.
Much like NGINX, HAProxy uses an evented I/O model and also supports using multiple worker processes to achieve parallelism across multiple CPUs.
Our configuration for HAProxy looks like this:
frontend frontend_server
	bind :80
	mode http
	default_backend backend_server

backend backend_server
	mode http
	balance roundrobin
	server server0 172.17.0.1:1234 check
Envoy load balancer
The Envoy Proxy is designed for “cloud native” applications. It claims to be built on a proxy and comes with support for HTTP/2, remote service discovery, advanced load balancing patterns such as circuit breakers and traffic shaping, and has a pluggable architecture that allows Envoy to be configured individually for each deployment. Additionally, Envoy can be used as a service mesh proxy and an edge load balancer, a feature that other tools lack.
In contrast to NGINX and HAProxy, Envoy uses a more sophisticated threading model with worker threads. This enables it to run in a single process but still achieve parallelism using every CPU available to it.
Envoy also supports multiple configurations. It supports static configuration, API-based configuration, and service-discovery-based configuration. For this test, we will use a static configuration file, which looks like this:
static_resources:
  listeners:
  - name: listener_0
    address:
      socket_address: { address: 0.0.0.0, port_value: 10000 }
    filter_chains:
    - filters:
      - name: envoy.http_connection_manager
        config:
          stat_prefix: ingress_http
          codec_type: AUTO
          route_config:
            name: local_route
            virtual_hosts:
            - name: local_service
              domains: ["*"]
              routes:
              - match: { prefix: "/" }
                route: { cluster: some_service }
          http_filters:
          - name: envoy.router
  clusters:
  - name: some_service
    connect_timeout: 0.25s
    type: STATIC
    lb_policy: ROUND_ROBIN
    hosts: [{ socket_address: { address: 172.17.0.1, port_value: 1234
}}]
Traefik load balancing
Traefik is a dynamic load balancer designed for ease of configuration, especially in dynamic environments. It supports automatic discovery of services, metrics, tracing, and has Let’s Encrypt support out of the box. Traefik provides a “ready to go” system for serving production traffic with these additions. It is based on the Go Programming Language, which encapsulates concurrency and parallelism features into the runtime to use all available resources on the system.
Our Traefik configuration looks like this:
[entryPoints]
  [entryPointshttp]
  address = ":80"

[file]

[backends]
[backends.backend1]
[backends.backend1.servers.server1]
url = "https://172.17.0.1:1234"
weight = 1

[frontends]
[frontends.frontend1]
backend = "backend1"
Amazon ALB
Our cloud load balancer is the Amazon ALB, which is an HTTP (L7) cloud-based load balancer and reverse proxy. It supports TLS certificates, path, and host-based forwarding, and is configured by either an API or the AWS UI.
While Amazon also has the Elastic Load Balancer and newer Network Load Balancer, the Application Load Balancer supports the L7 features needed to make the right comparison for this test, such as TLS termination.
Our ALB is configured to accept traffic on port 80 and 443 and forward it to our AWS instance on port 1234, where our back-end service is running.
Results
During our tests, we collected the total requests per second, the latency distribution, and a number of successful (200) responses. The raw data can be viewed on Google Sheets. This is a great deal of data to parse through, so we will look at a few trends across the data.
Concurrency vs. Tail Latency
First, we will look at concurrency as compared to tail latency for both the HTTP and HTTPS protocol. When using percentiles, tail latency is important because it shows the minority of requests that potentially have issues, even when the vast majority of requests are fast.
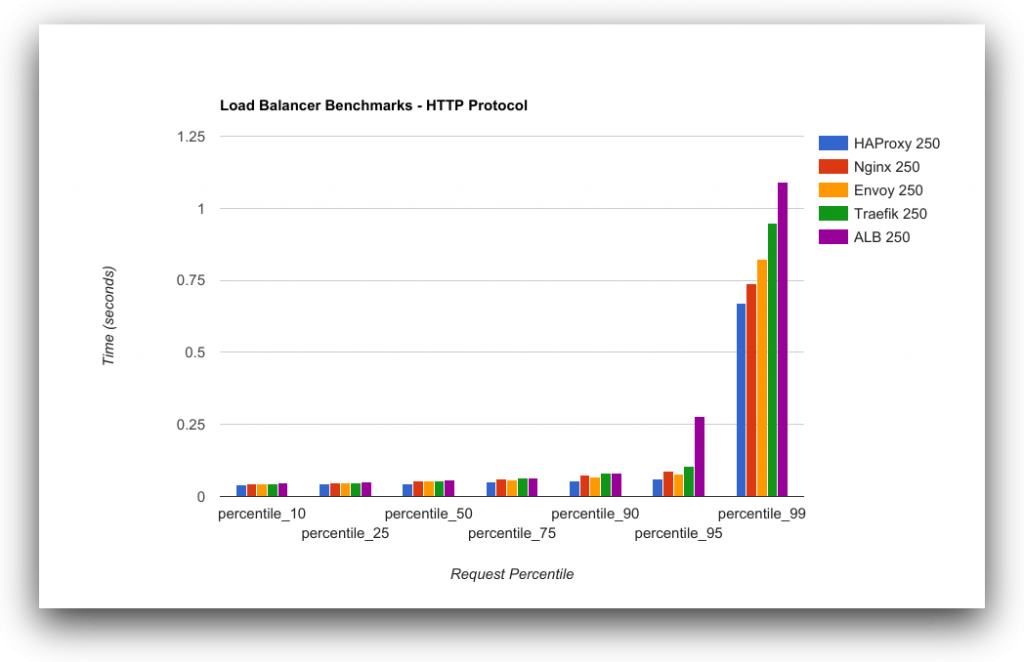
This chart shows the latency percentile distribution of load balancer responses over HTTP by concurrency. As an aggregate, 90% of all requests complete within 855 milliseconds (ms). At the 95th and 90th percentile, our response profile starts to change a bit. While requests at a concurrency level of 50 are still fast, they increase at the 99th percentile level for 250 concurrency, and dramatically starting at the 95th percentile for 500 concurrency.
This could mean several things, but at the core, it appears that load balancers perform worse under high bursts of traffic and take longer to respond to requests, affecting overall performance. Let’s look at the same data over HTTPS:
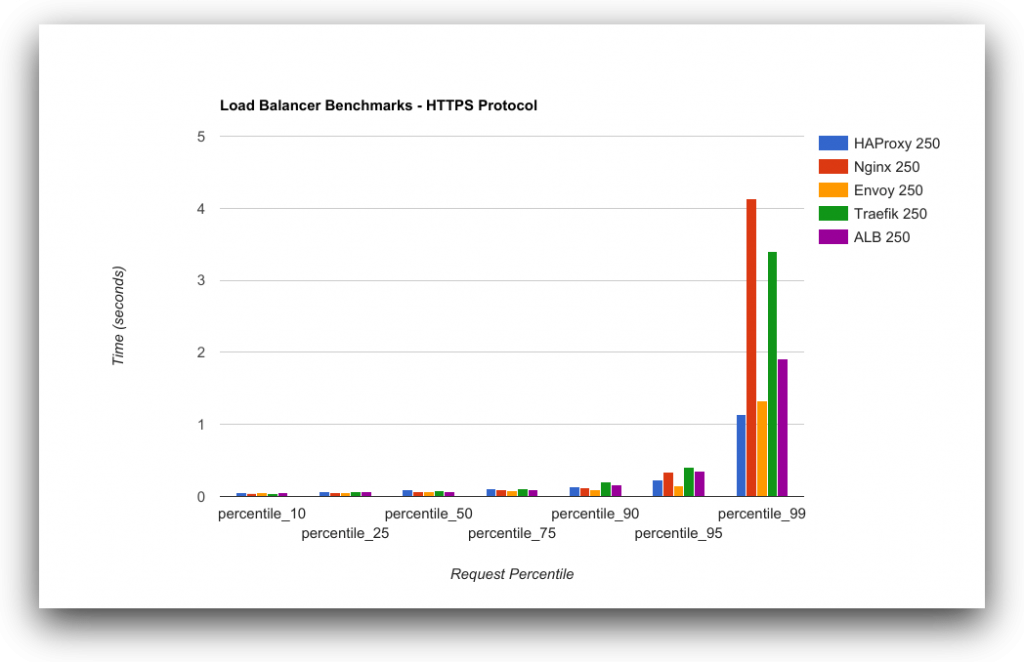
Much like our HTTP test, performance starts to sharply decline after the 90th percentile, but the tail end of poor performance grows larger with HTTPS—between our 75th and 90th percentile, our latency increases by 2.21 seconds! This means that concurrency is severely affected by choice of protocol. At the far extremes of concurrency and latency, TLS has a serious performance effect upon our response times.
From a response time perspective, HAProxy and Envoy both perform more consistently under load than any other option. HAProxy has the best performance for HTTP and is tied with Envoy for HTTPS.
Requests per second performance
Next, we will look at our requests per second. This measures the throughput of each of these systems under load, giving us a good idea of the performance profile for each of these load balancers as they scale:
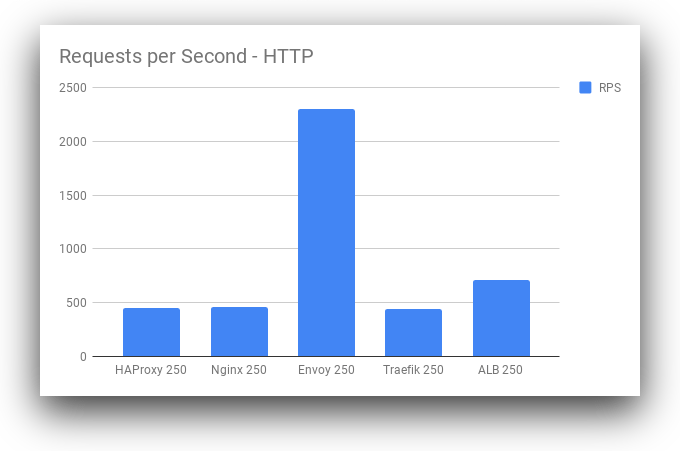
Surprisingly, Envoy has a far higher throughput than all other load balancers at the 250 concurrency range. While Envoy is also higher at other concurrency levels, the magnitude of the difference is especially high at the 250 concurrency level. This may be due to some intelligent load balancing or caching inside of Envoy as part of the defaults. It warrants further investigation to determine if this result is representative of real-world performance outside our limited benchmark. If so, Envoy deserves the attention it’s getting in the Ops community. Traefik stays more consistent under load than Nginx and HAProxy, but this may be mitigated by more optimized configuration of the other load balancers. Now, let’s look at HTTPS:
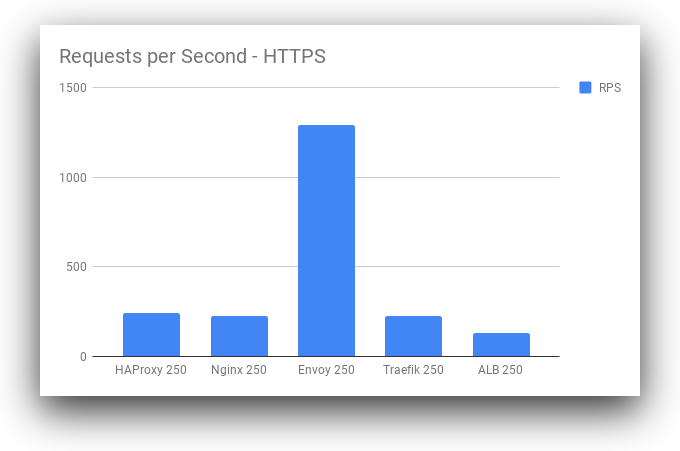
Envoy still remains in the lead by throughput with HTTPS. However, the performance profiles for HTTPS are much lower across the board. From a base performance level, our requests per second tend to drop significantly, up to 30% in some cases. This may be a combination of factors: SSL libraries used by the load balancer, ciphers supported by the client and server, and other factors such as key length for some algorithms.
Conclusion
Envoy came out as the overall winner in this benchmark. It had the highest throughput in terms of requests per second. It’s interesting that Envoy’s throughput was several times higher than others. While HAProxy narrowly beat it for lowest latency in HTTP, Envoy tied with it for HTTPS latency. However, this doesn’t tell the whole story. Different configurations can optimize each of these load balancers, and different workloads can have different results. Always benchmark using your tooling for different optimizations. Also, each load balancer supports a different feature set that may be more important to your needs than latency or throughput, such as ease of dynamic configuration changes. So which one do you want to apply in your system ? Its all depend on you …
