Password protected useful dashboard.
Aggregate multiple server netdata logs into one protected page.
How to set up a netdata cluster monitoring multiple servers. One dashboard, multiple server monitoring instances.

What do we want?
The aim of this tutorial is to allow the monitoring of multiple Linux server through one single and password protected dashboard. It is possible to add as many server and graph as you want.
I’m going to describe a use-case where you are using a free dynamic DNS service like no-ip.
Netdata Dashboard
We want each server to serve netdata webpage on /netdata/.
We need to choose a server which will host the netdata dashboard.
Remember: every web server must be configured to use SSL/TLS in order to work.
Example: We have:
- Raspberry Pi with domain daspi.com
- Server 1 with domain server1.com
- Server 2 with domain server2.com
- …
We want:Raspberry Pi (netdata collector)daspi.com/netdata/ (permit only to daspi.com)daspi.com/netdata-cluster/dashboard.html (password protected)server1.com/netdata/ (permit only to daspi.com)server2.com/netdata/ (permit only to daspi.com)
Netdata installation
We need to install netdata on each one the same way, and then decide which one will host the dashboard. In my case i used the Raspberry Pi.
I assume you have already enabled HTTPS in each server, in case you have to do it. You can find here all the instructions
Apache configuration
Create a directory on the raspi which will contain the dashboard.
$ sudo mkdir /var/www/netdata-clusterWe first need to install some modules for Apache:
$ sudo apt install libxml2-dev libapache2-mod-proxy-htmlThen we need to activate the mods:
$ sudo a2enmod proxy
$ sudo a2enmod proxy_html
$ sudo a2enmod proxy_http
$ sudo a2enmod xml2enc
Open the default vhost file for the HTTPS domain and add these lines at the end right before the enclosing VirtualHost tag.
In my case the config file is /etc/apache2/sites-available/default-ssl.conf.
        RewriteEngine On
        ProxyRequests Off
        ProxyPreserveHost on

        <location /netdata/ >
               Require host <YOUR DASHBOARD HOSTING DOMAIN>  //e.g. myraspi.com
        </location>

       <proxy>
            Order allow,deny
            Allow from all
       </proxy>
       <location /netdata-cluster/>
                AuthType Basic
                AuthName "Restricted Content"
                AuthUserFile /etc/apache2/.htpasswd
                Require valid-user
                Order deny,allow
                Allow from all
        </location>
        <Directory /netdata/ >
                Options -Indexes +FollowSymLinks
                AllowOverride all
                Order deny,allow
                Deny from all
       </Directory>

        ProxyPass "/netdata/" "http://127.0.0.1:19999/" connectiontimeout=5 timeout=30
        ProxyPassReverse "/netdata/" "http://127.0.0.1:19999/"
Verify the sintax is correct with: (should return Syntax OK)
$ apachectl configtestNow we are going to create the credentials for accessing the dashboard page
Install apache2-utils if you don’t have already and create a netdata user
$ sudo apt install apache2-utils
$ sudo htpasswd -c /etc/apache2/.htpasswd netdata
You have to insert the password for the user ‘netdata’ twice.
And restart apache.
Netdata Dashboard
Create a file into /var/www/netdata-cluster/dashboard.html, this will be your netdata collector.
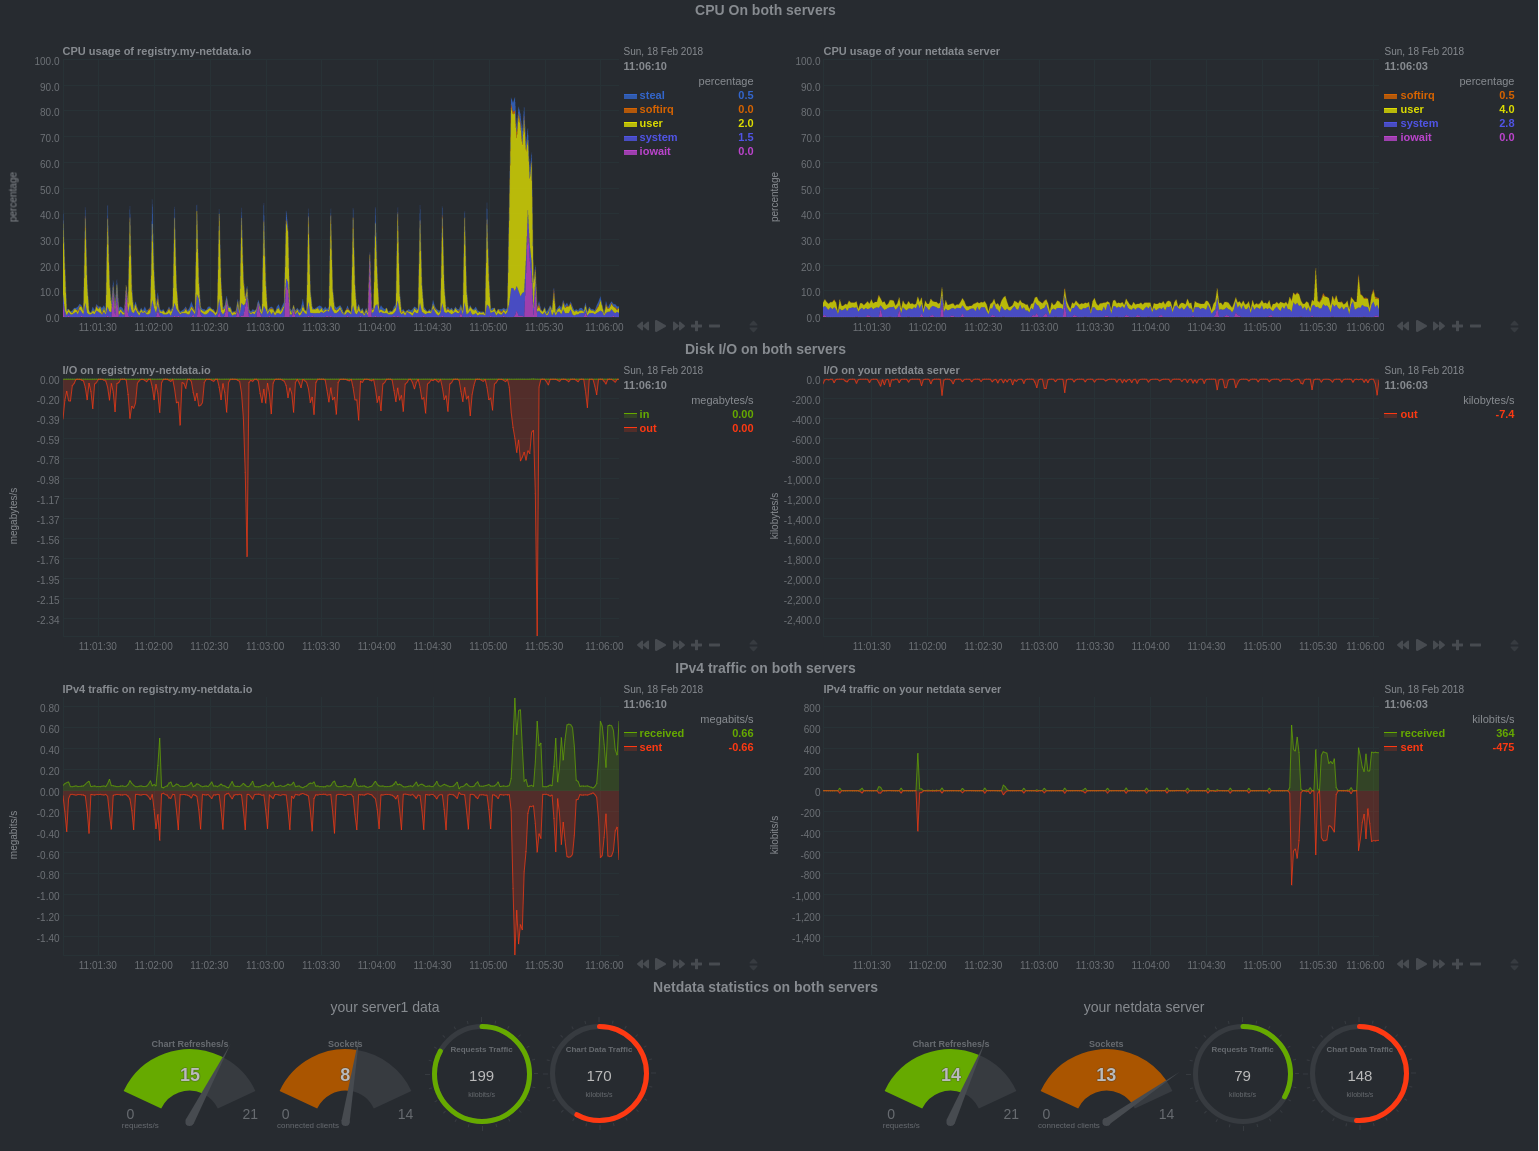
Here is an example provided by Netdata tv.html. You can copy it into your dashboard.html. It provide a simple example with some graph in comparison from 2 different server. We are going to load data from myraspi.com and srv1.com. You can add as many as you want.
Configuring dashboard to get data from servers
Very simple.
In dashboard.html the first thing to do is to load a dashboard Javascript file located in the Netdata collector (raspi).
Modify near row 52 the html script tag … to:
<script type="text/javascript" src="https://myraspi.com/netdata/dashboard.js"></script>The rest of the file include two graph for every row in which if you don’t specify the data-host value, netdata will set the default one (myraspi).
Every graph starts with e.g
<div data-netdata="system.io" .. >where system.io is the identification name of the graph.
All you need to do is to add/modify the line below:
data-host="http://registry.my-netdata.io"To:
data-host="https://server1.com/netdata/"for every graph (1 per row) in the file.
Results!

Security
For now we have made all traffic go through HTTPS and made the dashboard page password protected.. but
- Access to page /netdata/ is protected by Apache require host directive, but the IP/domain reverse lookup need to be addressed.
This because for some access restriction Apache will need to do a reverse lookup to check for the IP to hostname match and viceversa.
This configuration will cause Apache to perform a double reverse DNS lookup on the client IP address, regardless of the setting of the HostnameLookups directive. It will do a reverse DNS lookup on the IP address to find the associated hostname, and then do a forward lookup on the hostname to assure that it matches the original IP address. Only if the forward and reverse DNS are consistent and the hostname matches will access be allowed.
Ref: https://httpd.apache.org/docs/2.4/mod/mod_authz_host.html
The only way to allow Apache Require directive to work properly is to maintain updated an entry in the hosts file. We need to do this because free dynamic dns service does not provide a DNS PTR record so reverse lookup will always fail and apache will not be able to use its directives to protect the /netdata/ folder path.
Here is the script update-hosts.sh.
Open the file and edit the field DOMAIN to:
DOMAIN=daspi.comYou need to copy it into your /etc/cron.d folder and then setup a hourly cron job: (as root user)
$ crontab -eNow add at the end of the file:
@hourly root /etc/cron.d/update_iptables_domain_rule.shNow the script will automatically refresh the hosts file so that you don’t have to worry about the dynamic IP changes.
This way only the traffic from (-s) daspi.com will be allowed to access /netdata/ folder.
Please feel free to make any comment! If anything is unclear, just write in the comment and I will update the post! Thanks for reading!
